

The Lowdown on the Empirical Rule
/
So far we have discussed business science and what it is, the state of American business and provided an introduction to business process mapping. In this post, we will discuss the statistical concept known as the Empirical Rule.
What is the Empirical Rule?
The Empirical Rule is used to describe a phenomenon of a normal distribution. In a normal distribution, 68% of the observations will fall within one standard deviation of the mean (statistical average), 95% of the observations will fall within two standard deviations of the mean and 99.7% of observations will fall within three standard deviations of the mean.
Great, so if your head just exploded when you read this, let’s try to cut through some of the statistical jargon to conceptualize this idea. First, a normal distribution is simply a way to describe the shape of a data set. For example, we collected some process data on 100 observations of a process cycle time. The process cycle time is in seconds. The average process cycle time is 36 seconds, with a standard deviation of 5 seconds. Remember, the standard deviation is how far away from the center a point is on average. When we graph those cycle times in a graph called a histogram, below is the shape we get:

Notice how the shape slopes upwards, peaks at the center and then slopes downwards again. This is the classic example of the normal distribution, also known as the Gaussian distribution or called the “bell-shaped curve” on the street! Below is an image of a perfect bell shaped curve.
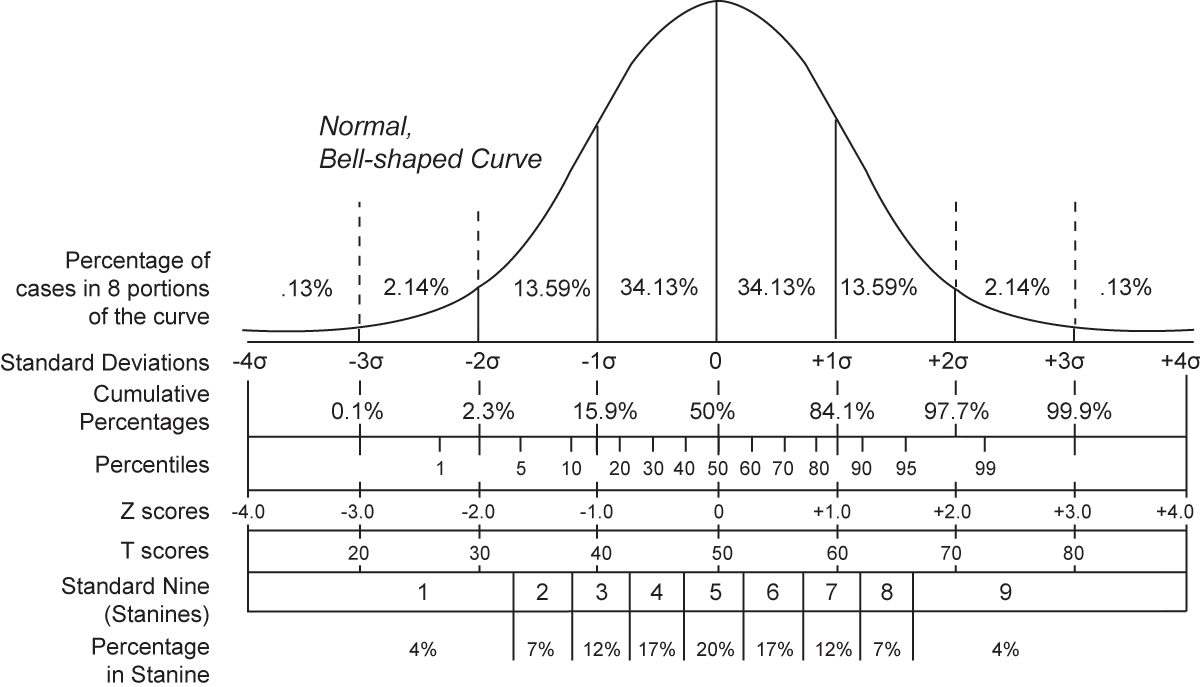
Back to the empirical rule, all the empirical rule is saying is that in our observations of our process cycle times, there is a 68% probability that a random point will fall within one standard deviation from our average. For our example, that means 68% of the time a point could be between 31 and 41 seconds (36 +/- 5).
Expanding that logic, that means that 95% of the time, a random observation will fall within two standard deviations from our average or center. In our example, that means that around 95% of the time, a point will fall between 26 and 46 seconds (36 +/- 5*2). This trend continues as the distance from the average is increased based on the empirical rule probabilities.
To bring it all together, the empirical rule is illustrating what is considered to be normal based on the variation in the process or measure being looked at.
What is This Used For?
The Empirical Rule is one of those useful statistical concepts that pops up time and again when analyzing data. It is a key fundamental when trying to understand what should and should not be happening in data analysis. Here are a couple of uses of the Empirical Rule:
1. Hypothesis Testing – While we have not covered this yet, basically think about it like this, if something changes in a process, how is known if that the change has any real effect on the outcome? The Empirical Rule helps set confidence intervals that can then be tested to see if outcomes from a change are the result of the normal process or are different from historical behavior. A hands on example of this could be making a website change and comparing the traffic before and after the change for a defined period. This is known as A/B testing.
2. Process Control – This is used to understand when things are going wrong in a process. By using the Empirical Rule, the data can show if an abnormal point is really abnormal, or if it is just at the high end of the distribution. This allows companies to either act to prevent a catastrophe or understand there is normal variation and let the process ride. Often reacting when we shouldn’t causes more variability and issues in a process. An example would be using control charts based on quality samples from a manufacturing machine. These charts help avoid unnecessary machine adjustments that could cause more harm than good and also warn of quality issues.
3. Creating Work Standards – When performing time studies and trying to set work standards, the Empirical Rule is used to set a standard that is achievable to the majority of the workforce measured. Most will conform to the center, but having a probability will help set the sweet spot of the process cycle time and allow outliers to be flagged and actioned.
4. Calculating Safety Stock Levels – Safety stock is used to protect a business against demand variation. The Empirical Rule is used to figure out how much safety stock should be held based on the desired service level (such as 95%) and the standard deviation of demand. This results in a level of inventory that minimizes service risk to the company’s commitments of available inventory to supply.
These are just a few examples of how the Empirical Rule is applied to real life. These principles apply across a wide array of industries and topics! What others can you think of?
A Word of Caution…
When applying this principle, there are a couple of things to remember. First, the Empirical Rule applies to Normal Distributions. Not every distribution is normal. There are many different types of distributions that operate differently.
Second, while not all distributions are normal, sampling often helps out with normality. The Central Limit Theorem applies here. This will be discussed in a different blog post. It is just something to keep in mind.
Third, many times a log transformation can make a distribution normal. Normal distributions are just easier to work with due to the Empirical Rule, so many times it is possible to transform data to be normal.
Fourth, the Empirical Rule improves as your sample size increases. Minimal data will make it hard to see the application. One will find the locations of where the observations lie from the average normalize as more data is measured. The probabilities are also imperfect. Points will not always lie one standard deviation from the mean exactly 68% of the time, but it will be in that ball park.
Conclusion:
There is a lot of information to be absorbed here. Hopefully, this post demystifies or properly introduces the Empirical Rule and Normal Distributions. As we move forward in our posts, we will discuss a management topic next on how process improvement is not meant to fire people. Stay tuned!

